Last Updated: June 2026 | Reading Time: 10 minutes
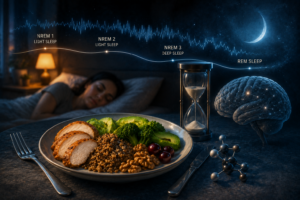
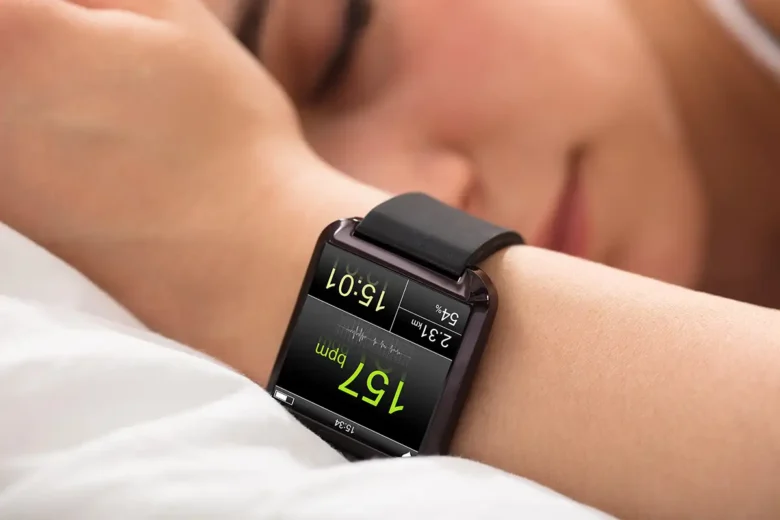
Consumer sleep trackers have transformed how people monitor their rest. Watches, rings, mats, and bedside monitors generate nightly reports filled with metrics: sleep stages, heart rate variability, respiratory rate, blood oxygen, and proprietary scores. The problem is that most users interpret these numbers without understanding what the devices actually measure, what they estimate, and what they simply cannot detect. This gap between data and understanding produces anxiety, misguided interventions, and a false sense of control.
This article breaks down the most common sleep tracking metrics, explains their scientific basis and limitations, and provides a framework for using data to improve sleep rather than obsessing over it.
Foundational Truth: No consumer device measures sleep directly. They measure proxies—movement, heart rate, blood oxygen, and skin temperature—and apply algorithms to estimate sleep states. The accuracy varies dramatically by metric, device, and individual. Treat the data as directional, not definitive.
How Sleep Trackers Actually Work
Understanding the technology beneath the metrics is essential for proper interpretation. Consumer devices fall into three categories based on their primary sensing modality:
Accelerometry-Based Trackers
These devices, including most fitness bands and smartwatches, rely primarily on movement detection. They assume that stillness indicates sleep and movement indicates wakefulness. Sleep stage estimation is derived from movement patterns combined with heart rate data if available.
Capabilities: Reasonably accurate for detecting sleep onset and total time in bed. Useful for identifying nights with frequent awakenings or restlessness.
Limitations: Cannot distinguish between lying still awake and actual sleep. Often misclassifies quiet wakefulness as light sleep. Stage estimation is the least accurate of all device categories. Individuals with sleep disorders involving minimal movement, such as sleep apnea, may receive falsely positive sleep efficiency scores.
Photoplethysmography (PPG) Trackers
These devices use optical sensors to detect blood volume changes in peripheral vessels, deriving heart rate and heart rate variability (HRV). Some also estimate blood oxygen saturation (SpO₂). Sleep stage classification incorporates HRV patterns, which correlate with autonomic nervous system changes across sleep stages.
Capabilities: Superior to accelerometry alone for distinguishing sleep stages. HRV patterns show characteristic signatures: high HRV during REM, lower HRV during deep sleep, and intermediate during light sleep.
Limitations: PPG signals are susceptible to motion artifacts, ambient light interference, and poor skin contact. Dark skin tones and tattoos can reduce signal quality. Blood oxygen estimation is less accurate than medical pulse oximetry, particularly during movement.
Multi-Modal and Contactless Systems
Advanced devices combine multiple sensors: accelerometry, PPG, temperature, respiratory rate, and sometimes ballistocardiography (detecting heartbeats through mattress movement). Contactless systems use radar or pressure sensors to detect movement and breathing without wearable attachment.
Capabilities: The most comprehensive consumer estimation available. Some systems approach 80-85% agreement with polysomnography for sleep-wake detection and 70-75% for stage classification.
Limitations: Even the best consumer devices remain significantly less accurate than clinical polysomnography. Multi-person beds, pets, and irregular breathing patterns degrade contactless system performance.
Metric-by-Metric Interpretation
Total Sleep Time
This is the most reliable consumer metric because it requires only sleep-wake detection, not stage classification. Most devices achieve 85-95% accuracy for determining when you fell asleep and when you woke, provided you actually wore or activated the device.
How to use it: Track consistency rather than absolute nightly values. A stable total sleep time within a 30-minute range across nights is more important than hitting an arbitrary 8-hour target. Gradual declines over weeks may indicate accumulating sleep debt, illness, or lifestyle changes.
Common misinterpretation: Assuming that more sleep is always better. Sleep need is individual and varies with physical exertion, illness, and life stage. Consistently sleeping 9+ hours without daytime impairment is normal for some individuals. Forcing reduction to meet a perceived ideal is counterproductive.
Sleep Efficiency
Sleep efficiency is calculated as the percentage of time in bed that is spent sleeping. Values above 85% are generally considered normal; above 90% is often interpreted as excellent.
How to use it: Efficiency is useful for identifying insomnia patterns. Repeated nights below 80% suggest difficulty initiating or maintaining sleep. However, efficiency must be interpreted alongside total sleep time. A person with 6 hours of sleep from 6.5 hours in bed (92% efficiency) is not necessarily better rested than someone with 8 hours from 9 hours in bed (89% efficiency).
Common misinterpretation: Pursuing 100% efficiency by minimizing time in bed. This can create performance anxiety around sleep and paradoxically worsen insomnia. The goal is sufficient restorative sleep, not perfect efficiency metrics.
Sleep Stages (Light, Deep, REM)
This is where consumer accuracy is weakest and user obsession is strongest. Sleep stage classification requires detecting brain wave patterns (EEG), which no mainstream consumer device measures directly. Algorithms infer stages from heart rate, movement, and sometimes respiratory patterns.
Validation studies comparing consumer devices to polysomnography show:
- Wake detection: 60-85% accuracy (devices often miss brief awakenings)
- Light sleep detection: 50-70% accuracy (frequently confused with quiet wakefulness or deep sleep)
- Deep sleep detection: 60-80% accuracy (tends to be overestimated in some devices, underestimated in others)
- REM detection: 50-70% accuracy (often missed entirely or fragmented across other stages)
📊 Interpreting Stage Data
Because absolute stage percentages are unreliable, focus on these validated patterns instead:
Trend Direction Over Weeks
A declining deep sleep trend over a month may indicate increased stress, alcohol use, or temperature disruption. A stable trend despite lifestyle changes suggests adaptation.
Relative Proportions, Not Absolute Percentages
If your device consistently shows 15% deep sleep and 20% REM, the ratio matters more than whether these match population averages. Sudden shifts in ratio are more meaningful than steady states.
Timing Distribution
Deep sleep clusters in the first third of the night; REM in the final third. Devices that show deep sleep late or REM early may indicate circadian misalignment, even if absolute percentages appear normal.
Heart Rate Variability (HRV)
HRV measures the variation in time between consecutive heartbeats. Higher HRV generally indicates greater parasympathetic (rest-and-digest) activity and better autonomic flexibility. During sleep, HRV patterns change across stages and provide information about recovery quality.
How to use it:
- Nighttime HRV average: Compare it to your personal baseline rather than population norms. Individual HRV ranges vary enormously based on age, fitness, and genetics.
- HRV trajectory: Ideally, HRV rises during the first half of sleep (parasympathetic dominance increasing) and may decline slightly before waking. A flat or declining trajectory throughout the night suggests incomplete recovery.
- Morning readiness scores: Proprietary algorithms combining HRV with sleep metrics. Treat these as heuristic guides, not medical assessments. A low readiness score on a day you feel fine is not a command to rest; it is a prompt for self-assessment.
Common misinterpretation: Equating higher HRV with better health in all contexts. Extremely high HRV can indicate parasympathetic overdominance or atrioventricular block in some individuals. The trend and pattern matter more than any single value.
Resting Heart Rate (RHR) During Sleep
Sleep RHR typically reaches its nadir in the middle of the night, reflecting peak parasympathetic activity. The magnitude of this drop and its timing provide recovery information.
How to use it:
- Track the lowest nightly RHR and its trend over weeks. Gradual elevation may indicate overtraining, illness onset, or chronic stress accumulation.
- Note the timing of the nadir. A nadir occurring too early (first half of night) may suggest premature sympathetic reactivation. A nadir too late may indicate delayed sleep onset or circadian misalignment.
Common misinterpretation: Comparing absolute RHR to others. Elite athletes may have sleep RHR in the 30s; sedentary individuals in the 60s. Both can be healthy for their context. The individual trend is the signal.
Blood Oxygen (SpO₂)
Some devices estimate blood oxygen saturation during sleep, typically reporting average values and time below 90%. This metric is primarily relevant for detecting sleep-disordered breathing.
How to use it:
- Consistent averages above 95% with minimal time below 90% suggest normal nocturnal oxygenation.
- Frequent dips below 90%, particularly if clustered in specific sleep positions or times, warrant medical evaluation for sleep apnea.
- Altitude, respiratory conditions, and device error can produce false lows. Single-night anomalies should not trigger alarms.
Critical limitation: Consumer SpO₂ estimation is not equivalent to medical pulse oximetry. Accuracy degrades during movement, low perfusion, and irregular heart rhythms. A device reporting 92% average may reflect true hypoxemia or simply measurement error. Persistent low readings require clinical confirmation, not self-diagnosis.
Respiratory Rate
Nocturnal respiratory rate is typically stable and slightly lower than waking rates. Some devices report this metric, though it is less commonly tracked by users.
How to use it: Elevated or irregular respiratory rate during sleep may indicate airway obstruction, anxiety, or fever. A stable low rate suggests relaxed breathing and adequate ventilation. Significant night-to-night variation is more informative than absolute values.
The Orthosomnia Trap
Orthosomnia is a term coined by sleep researchers to describe the condition of becoming so preoccupied with achieving perfect sleep metrics that the preoccupation itself disrupts sleep. The anxiety generated by tracking data creates a self-defeating cycle:
<
- User checks sleep score upon waking and feels disappointed
- Daytime rumination about poor sleep increases stress
- Evening anxiety about achieving better metrics makes sleep onset difficult
- Actual sleep quality declines
- Tracker confirms the decline, reinforcing anxiety
Research from Rush University Medical Center and Northwestern University has documented this phenomenon. Users who check their sleep data multiple times daily show higher sleep-related anxiety and poorer subjective sleep quality than those who review data weekly or less frequently, even when objective metrics are similar.
The intervention is not to abandon tracking but to modify the relationship with data:
- Review data no more than once daily, ideally not immediately upon waking
- Focus on weekly averages rather than nightly fluctuations
- Do not make same-day behavioral changes based on a single night’s data
- Recognize that subjective well-being is the ultimate metric; tracker data is supplementary
Building a Useful Tracking Practice
Effective sleep tracking requires a structured approach that extracts signal from noise.
Step 1: Establish a Baseline
Track for two weeks without modifying behavior. Record sleep metrics alongside subjective ratings: morning grogginess, daytime energy, mood stability, and cognitive clarity. This establishes your personal normal range, which may differ from population averages.
Step 2: Identify Correlates
After the baseline, introduce one variable at a time (earlier bedtime, alcohol elimination, temperature change, evening screen reduction). Track for one week minimum. Compare to baseline. Look for consistent patterns rather than single-night changes.
Step 3: Validate with Subjective Measures
Tracker data should correlate with how you feel. Persistent divergence between objective metrics and subjective experience suggests device inaccuracy or misinterpretation. Trust your body when the data contradicts it.
Step 4: Periodic Reassessment
Re-establish the baseline every 3-4 months. Sleep needs and patterns change with seasons, training loads, stress levels, and aging. A metric that was optimal in January may be irrelevant by June.
When Tracking Data Warrants Medical Consultation
Consumer tracking should never replace clinical evaluation, but certain patterns legitimately prompt professional assessment:
⚠️ Red Flags Requiring Medical Evaluation
- Consistent SpO₂ below 90%: Suggests sleep-disordered breathing requiring polysomnography
- Extremely fragmented sleep with minimal deep or REM: May indicate periodic limb movement disorder, sleep apnea, or narcolepsy
- Severe discrepancy between device data and subjective experience: Device may be malfunctioning, or you may have a condition (such as idiopathic hypersomnia) where sleep architecture appears normal but restorative function is impaired
- Tracker-detected arrhythmias: Some devices flag irregular heart rhythms. These require clinical confirmation with ECG, not dismissal or self-treatment
Related Articles
- Circadian Rhythm Hacking for Better Deep Sleep Cycles
- How Bedroom Temperature Affects REM Sleep Quality
- Blue Light Exposure: Separating Myth From Measurable Impact
- Sleep Hygiene’s Direct Impact on Emotional Regulation
- Cognitive Behavioral Techniques You Can Practice Daily
- Digital Detox Strategies for Chronic Overthinkers
- Journaling Methods That Reduce Stress Hormone Levels
- Boundary Setting: Protecting Mental Energy in Relationships
References and Sources
- de Zambotti, M., et al. (2018). The Sleep of the Ring: Comparison of the ŌURA Sleep Tracker Against Polysomnography. Behavioral Sleep Medicine, 16(4), 378-386. https://doi.org/10.1080/15402002.2016.1228642
- Baron, K. G., et al. (2018). Orthosomnia: Are Some Patients Taking the Quantified Self Too Far? Journal of Clinical Sleep Medicine, 14(2), 351-352.
- Menghini, L., et al. (2021). Measuring sleep: Accuracy, sensitivity, and specificity of consumer-grade fitness trackers compared to polysomnography and actigraphy in a clinical population. Sleep, 44(5), zsaa291.
- Beattie, Z., et al. (2017). Estimating sleep parameters using an accelerometer without sleep diary. Scientific Reports, 7(1), 13767.
- Depner, C. M., et al. (2019). Wearable technologies for developing sleep interventions. Annual Review of Biomedical Data Science, 2, 319-338.
- American Academy of Sleep Medicine. (2024). Consumer Sleep Technology: An AASM Position Statement. https://aasm.org/consumer-sleep-technology/
- Reid, K. (2026). Understanding Sleep Data: A Guide for Consumers and Clinicians. Sleep Research Society.
- Luik, A. I., et al. (2017). 24-hour activity rhythm and sleep disturbances in depression and anxiety: A population-based study of middle-aged and older persons. Depression and Anxiety, 34(7), 624-633.
Medical Disclaimer: This article is for informational purposes only and does not constitute medical advice. Consumer sleep trackers are not diagnostic devices. Persistent sleep concerns or abnormal metrics require evaluation by a qualified sleep specialist.